

VIX – Complacency With a Clock?
2025-08-12

Volatility has a bad habit of playing possum — it lies still, lets everyone get comfortable, then bolts upright when you least expect it. The VIX is no exception.
The VIX closed today at 14.7, down nearly 9.4% from just yesterday, and almost 29% lower than this time last year (around 20.7). That puts it in what history calls “quiet territory” — a zone that rarely lasts, take note. The story here isn’t whether vol stays low this month. It’s simply a matter of when will we see the inevitable lift. Historically, VIX under 20 signals market complacency; spikes above 30 reflect genuine fear. True shocks — 2008, March 2020 — have pushed it over 80, even cracking 60.5 in April of this year. Today’s print isn’t unusual in isolation, but the combination of compressed vol, stretched risk appetite, and approaching rate cuts is worth watching.

5 Historical Calm-to-Spike Studies Overview
Nov 3, 2017 – Feb 5, 2018
VIX closed at 9.14, held under 12 for 50 days (calm period pattern: extended sub-12 readings with steady equity grind). Then surged to 37.32 (+300%) on the “Volmageddon” unwind (spike period pattern: rapid 1–2 day explosion on leverage unwinds).Nov 26, 2019 – Mar 16, 2020
From 12.10 for about 40 days (calm period pattern: tight range, muted skew) to 82.69 (+580%) as pandemic fears erupted (spike period pattern: multi-week climb with cascading volatility).Jul 3, 2014 – Oct 15, 2014
From 10.32 for approximately 45 days (calm period pattern: slow bleed in IV, low realized vol) to 31.06 (+200%) during global growth scare (spike period pattern: sharp mid-month jump tied to macro headlines).Apr 18, 2007 – Aug 16, 2007
From 11.42 for around 60 days (calm period pattern: complacent credit and equity spreads) to 37.50 (+228%) as the subprime crisis surfaced (spike period pattern: sustained volatility repricing over weeks).Jan 24, 2006 – May 22, 2006
From 10.18 approximately 50 days (calm period pattern: range-bound indices, flat skew) to 23.81 (+134%) on emerging-market jitters (spike period pattern: 1–2 week volatility repricing).
10-Year VIX vs. S&P 500 — The S&P 500 is up 223.38% over the past decade, while the VIX is down 43.38%, with volatility mostly subdued except for sharp spikes during market stress in 2018, 2020, and 2025.
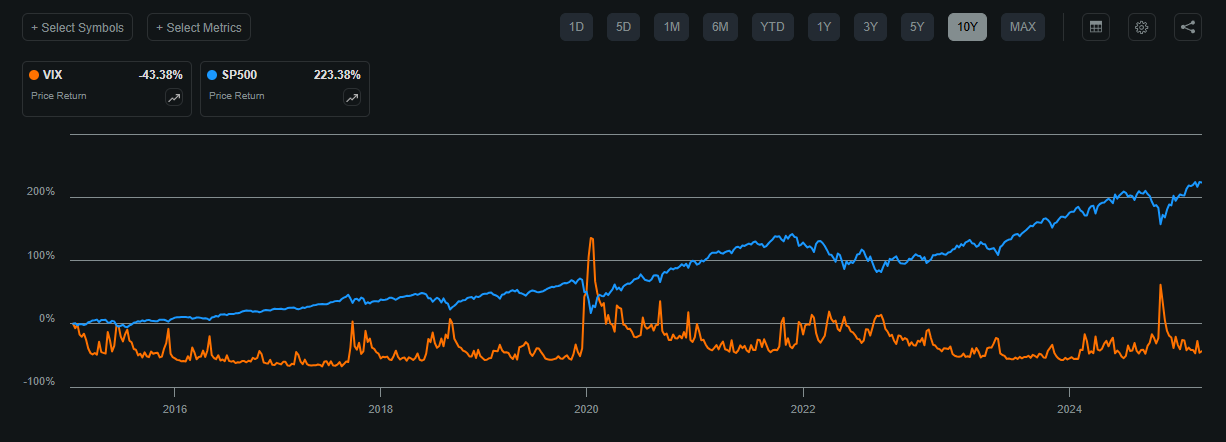
Source: Seeking Alpha - 10Y Look at the VIX
Options & Sentiment Flow
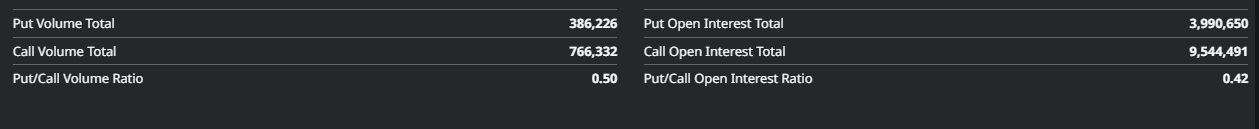
VIX Put/Call Volume Ratio: 0.50 — calls trading at roughly twice the volume of puts, showing traders leaning toward upside volatility plays rather than pure downside hedging.
SPX Skew: Downside skew remains steep, with protective puts pricing at a ~25–30% implied vol premium over similar-dated calls, indicating ongoing demand for tail risk protection.
Positioning by Expiry: VIX call activity is concentrated in the Oct–Dec contracts, particularly in the 20–25 strike range, pointing to expectations for higher volatility into year-end despite the current calm.
VIX is trading near recent lows, with a put/call volume ratio (0.5)…holding below 1.0 for much of 2025, indicating more call activity relative to puts. Open interest ratio remains subdued, suggesting limited longer-term positioning despite an 85th percentile implied volatility reading.
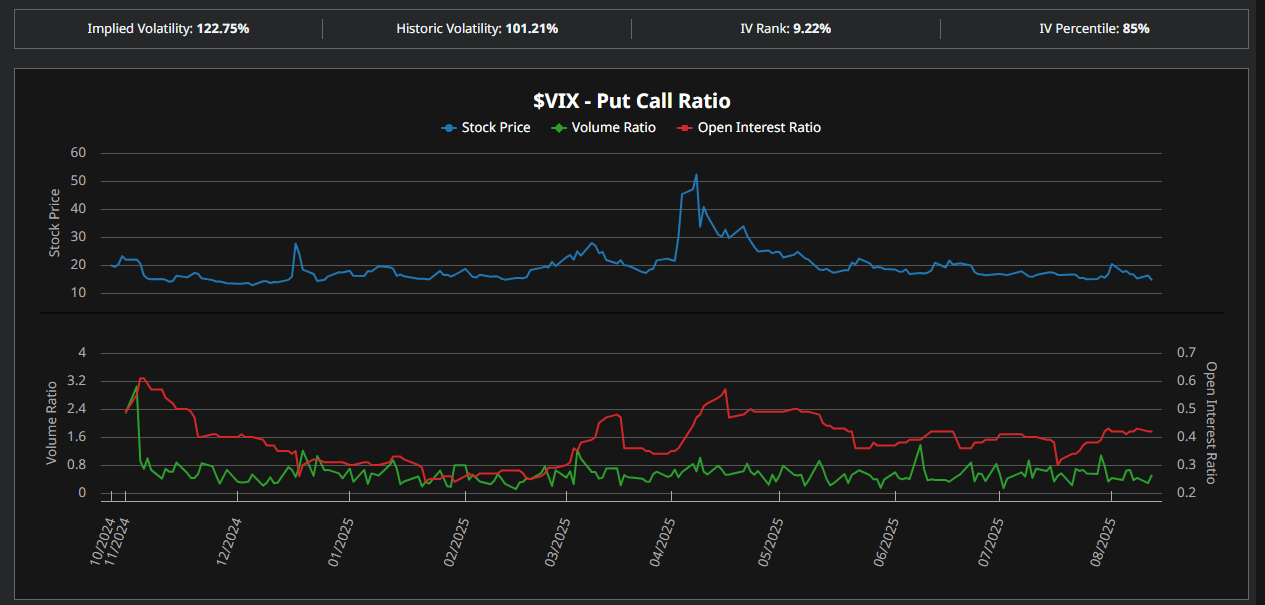
Source: Barchart
Turtle Channel Retracement
The VIX’s drop from April’s 62 peak to today’s 14.73 mirrors past TC retracements where extended calm was followed by a sharp rebound. Whether driven by macro shocks, earnings season, or policy shifts, history shows volatility tends to revert — making a revisit to higher levels more a question of when than if.
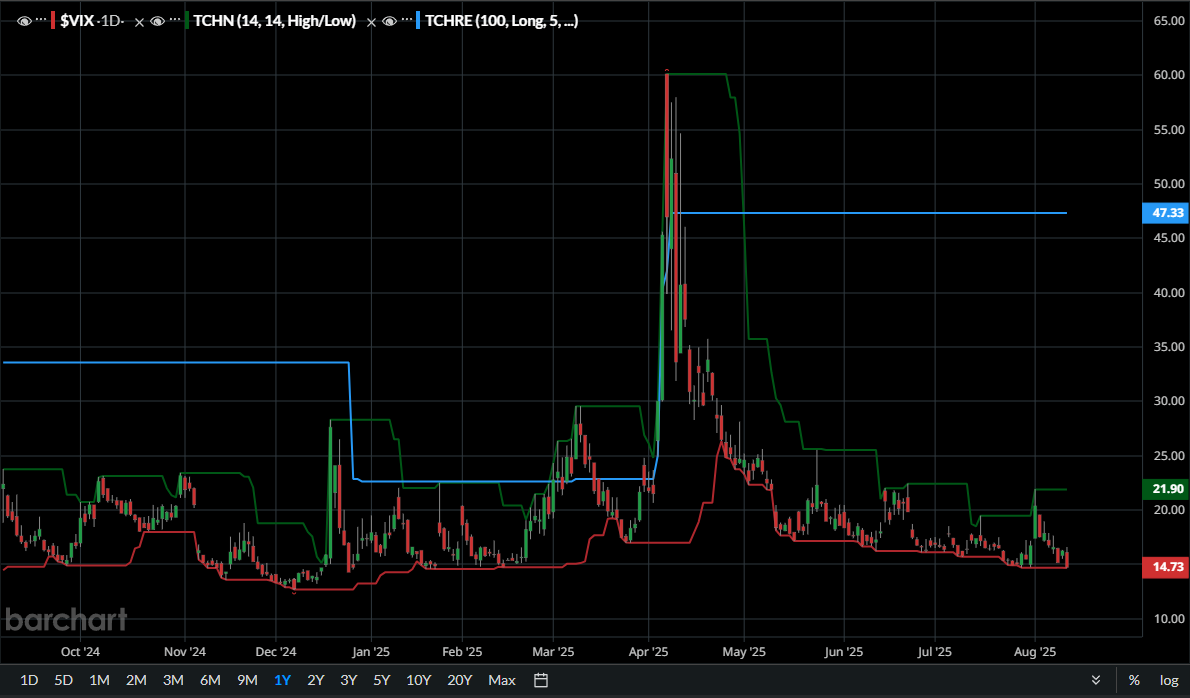
Source: Barchart
Macro Setup & Market Pricing
Fed-funds futures now imply roughly a 90% chance of a September rate cut, with additional easing expected into Q4. Historically, first cuts after a tightening cycle often lift volatility when we look at historical data — particularly when markets see them as a reaction to slowing growth rather than proactive policy.
Earnings season is closing with a positive skew, but macro risk remains a live wire: tariff headlines, geopolitical flare-ups, and policy change could all serve as some serious vol triggers. Not to mention, the options market is pricing in a +/- 3–4% SPX move into September’s Fed meeting, kind of modest compared to past FOMC setups. Beyond that, the curve steepens — October and November VIX futures sit above 18, signaling expectations for what looks like a Q4 pickup in volatility.

Conclusion
We’ll likely see the bull market continue to play out unless a true black swan emerges. The VIX holding at these historically low levels isn’t inherently bearish — it reflects current liquidity, positioning, and a market leaning on confidence. Still, volatility has a way of returning quickly once the right catalyst hits.
From here, the prevailing calm could extend into the new year at most, in line with many analysts’ expectations for stability from October through the end of Q1 2026 — though that horizon feels further out than the market often allows. The setup is less about calling the exact turn and more about staying structurally prepared for when it comes. Rate cuts, macro shifts, and seasonal flows will shape the path, but history suggests extended quiet… rarely lasts forever.
Thanks for reading.
Disclaimer: This content is for informational and educational purposes only and should not be considered financial advice. Always do your own research before making investment decisions.