

Identifying a Market Sentiment Shift via Fresh Unusual Options Flows
2025-08-02

As August kicks off, the options tape is telling a different story than the macro headlines. While the narrative sticks to soft-landing chatter and sticky inflation, flow suggests funds are already rotating. Puts and shorts are back in town—because nothing rallies quite like a wall of worry.
We’re still seeing bullish call buying in high-beta names—AI infra, crypto plays, fintech, even regionals. At the same time, targeted put hedges are spiking up where risk needs managing, not looking necessarily like pure-directional plays, for now...
This isn’t blind bullishness or panic—it's re-risking with insurance. Capital is moving back into convex upside, while protecting the edges.
Below: the highest-signal trades from August 2, and what they say about where smart money’s leaning next. We also explore the call/put ratio data to get a closer look.
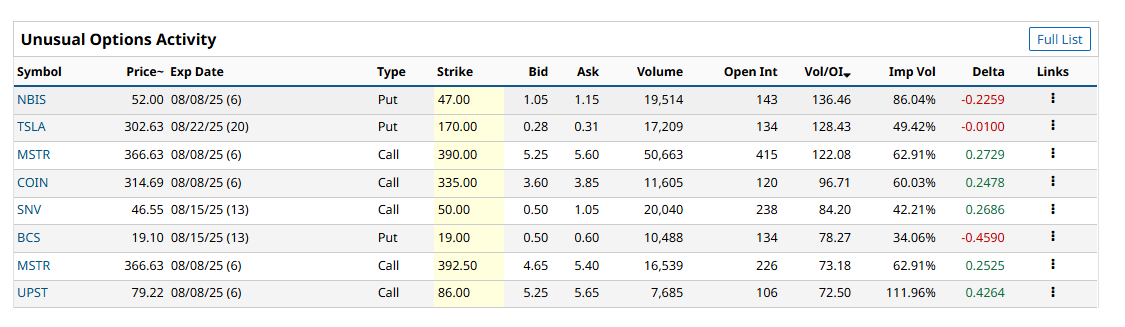
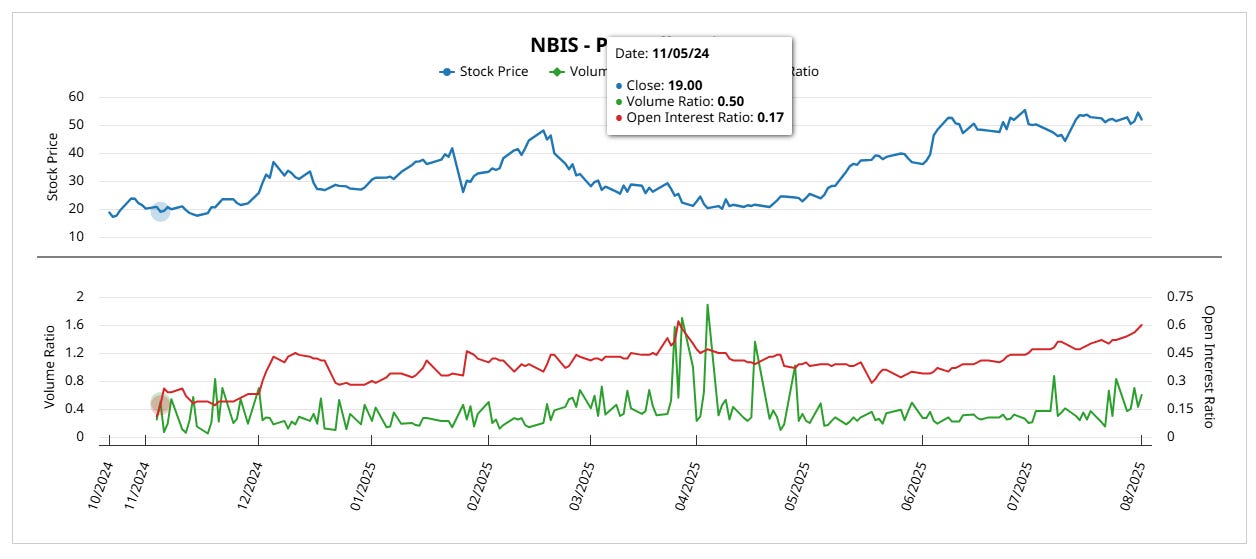
NBIS (Nebius Group)
Dutch-based AI/cloud infrastructure player. Trading around $52, with a ~$12B market cap. Short interest ~5.1%; borrow rate ~0.7%. I’ve traded and invested in Nebius previously with good results, but for now we’re on the sidelines—watching for more confirmation before re-engaging.
Options Activity – Aug 8 $47 Puts
Volume: 19,514
Open Interest: 143 → Vol/OI ≈ 136×
Implied Vol: 86%
Delta: –0.23
Classic hedge structure. Low-delta, short-dated. Looks like institutional protection—not a directional short bet.
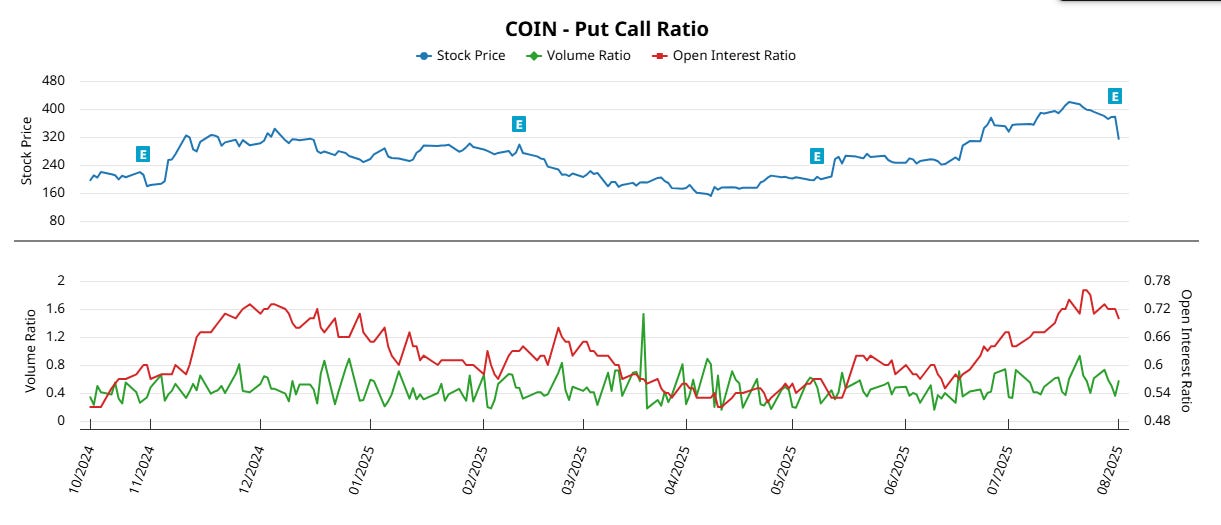
COIN – Coinbase
Flow Recap: Aug 8 $335 Call
11,605 contracts | IV ~60% | Delta ~0.25
Chart Read
Volume ratio consistently call-dominant since May.
Open interest ratio has moved steadily lower, reinforcing bullish directional bias.
Call-side conviction has built steadily in COIN. The breakdown in the put/call open interest ratio confirms this is upside speculation, not neutral hedging.
Per Barchart
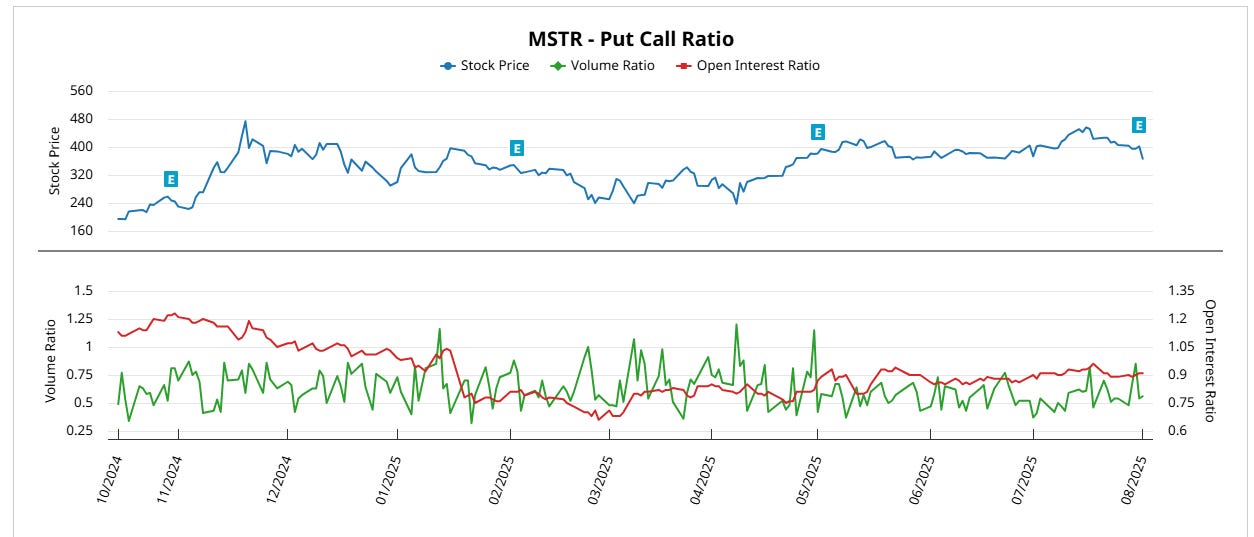
MSTR – MicroStrategy
Flow Recap: Aug 8 $390 & $392.5 Calls
~67K contracts combined | IV ~63% | Delta ~0.25
Chart Read
Put/Call open interest ratio has been grinding down since late 2024—now under 0.90.
Volume ratio spikes have mostly favored calls, confirming directional long exposure, not hedging.
MSTR’s falling put/call open interest ratio and neutral-to-bullish volume spikes align with leveraged upside positioning. Options flow is not hedged—this is risk-on Bitcoin proxy exposure.
Source: Barchart
UPST – Upstart Holdings
Flow Recap: Aug 8 $86 Call
7,685 contracts | IV ~112% | Delta ~0.43
Chart Read
Volume ratio remains well below 1.0 (hovering around 0.5), implying calls dominating flow.
Open interest ratio has trended lower since Q1 2025, consistent with bullish rotation.
UPST shows consistent call-side bias. Volume ratio remains call-heavy, while open interest suggests unwinding put protection—supporting the upside breakout thesis.
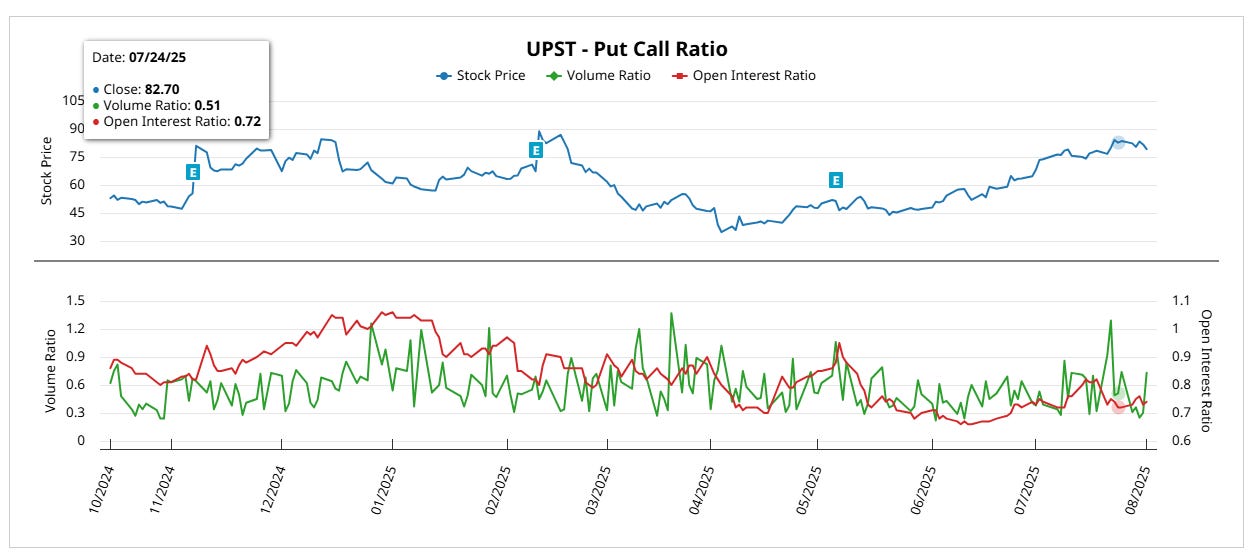
Source: Barchart
SNV – Synovus Financial
Flow Recap: Aug 15 $50 Call
20,040 contracts | Delta ~0.27
Chart Read
Put/call volume and open interest ratios are structurally low—barely registering activity until late July.
Sudden spike in OI ratio into August hints at fresh positioning, likely driven by macro inflection (yield curve shift, rate expectations).
Call flow appears to be early and opportunistic. The late July jump in open interest suggests fresh institutional engagement—likely yield/financial rotation in play.
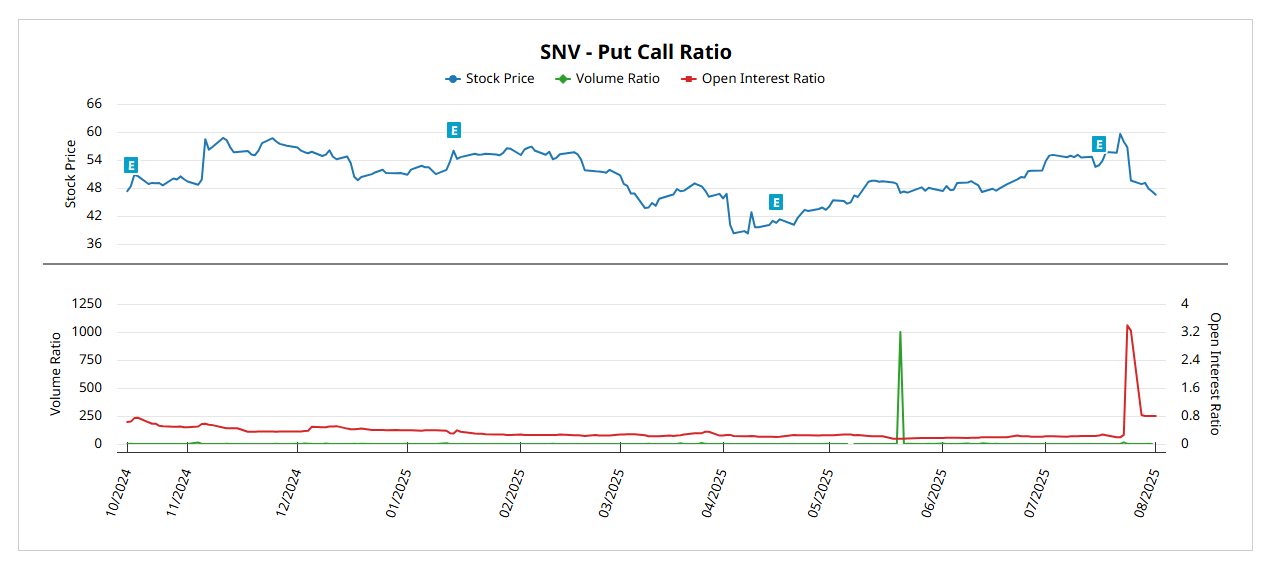
Source: Barchart
TSLA – Tesla
Flow Recap: Aug 22 $170 Put
17,209 contracts | Delta ~–0.01
Chart Read
Open interest and volume ratios have remained mostly balanced. No sharp skew either way.
That said, recent put volume has outpaced calls—likely reflecting tail-risk protection, not directional conviction.
TSLA’s options flow reflects balanced positioning. Low-delta put buying looks like portfolio-level insurance, not a fundamental short.
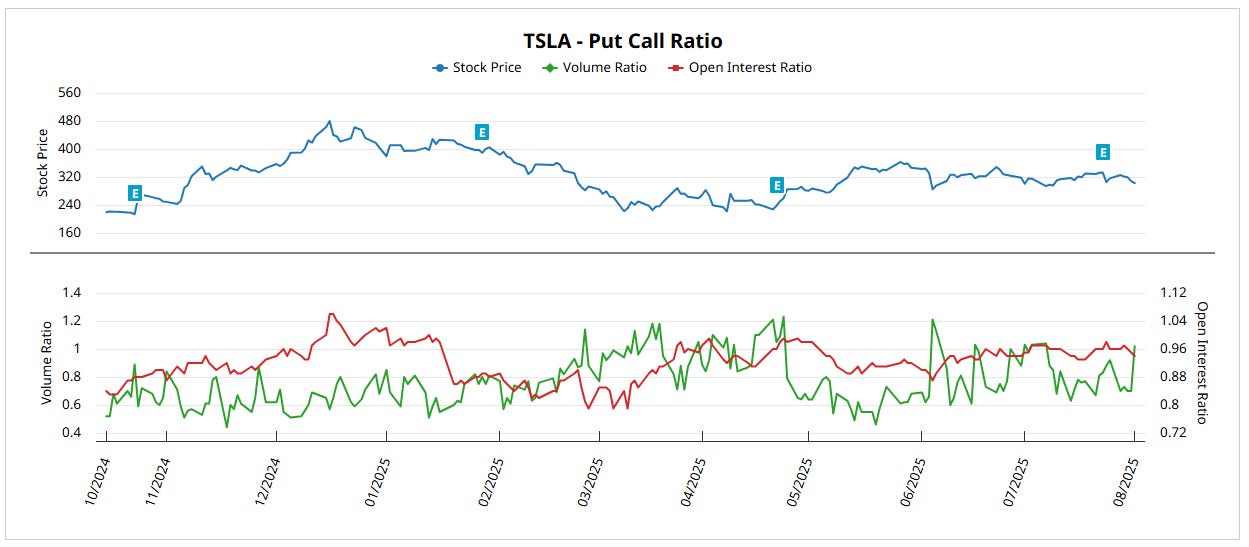
Source: Barchart
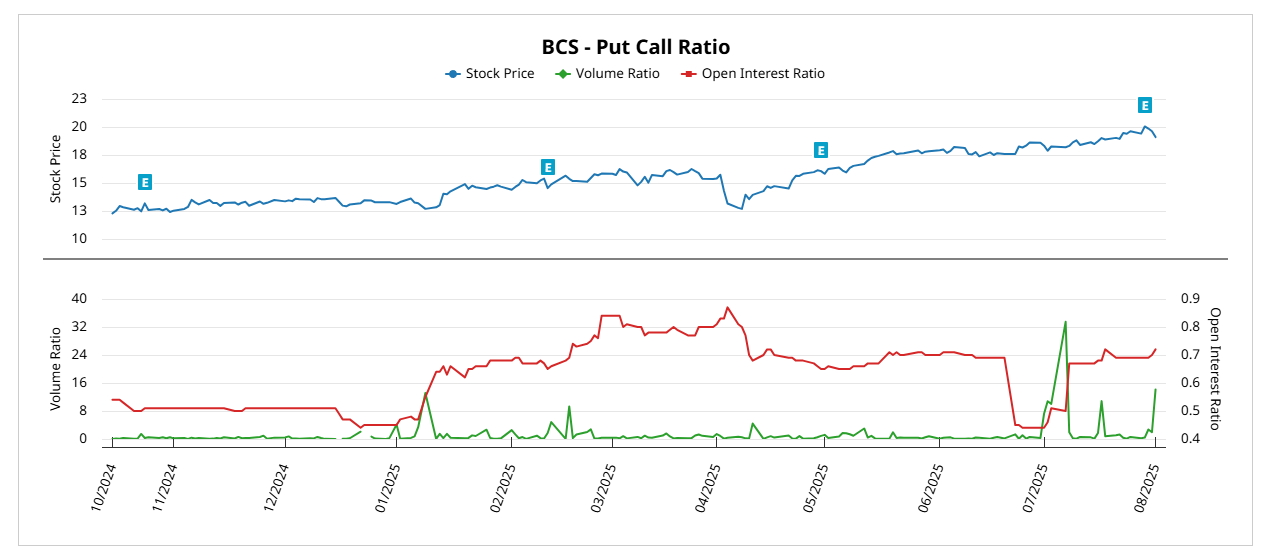
BCS – Barclays
Flow Recap: Aug 15 $19 Put
10,488 contracts | Delta ~–0.46
Chart Read
Open interest ratio remains elevated, while volume ratio has seen sharp spikes—especially around mid-July.
Structurally tilted toward put bias, reflecting hedging tied to macro or credit exposures.
BCS shows sustained put-side buildup. The flow matches geopolitical/macro hedging behavior, likely not name-specific bearishness.
Breadth Paints a Cautious Tape
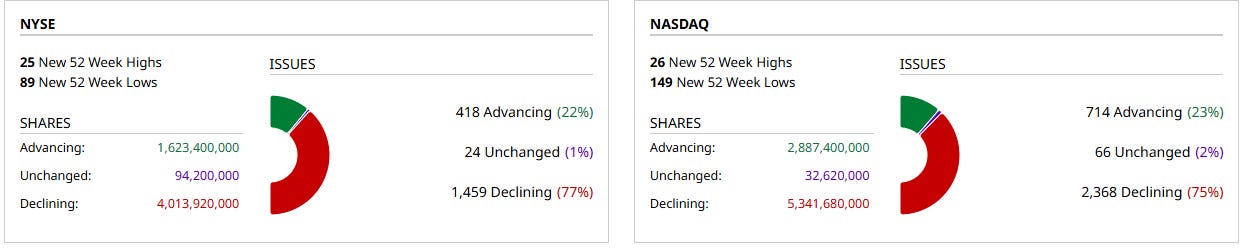
Despite the pockets of speculative call activity and large-scale institutional positioning, broader market internals remain weak. On Friday, over 75% of NASDAQ and NYSE issues closed lower, with more than 5.3B declining shares on NASDAQ and 4B on NYSE. New 52-week lows significantly outpaced highs—89 to 25 on NYSE and 149 to 26 on NASDAQ—signaling a market still under pressure beneath the surface.
This kind of internal divergence—where a handful of names attract capital while the majority slide—often appears during regime shifts or late-stage rotations. It doesn’t negate the upside flows we’re seeing, but it does temper the tape. Breadth weakness, especially across small and mid caps, suggests a narrow market where positioning must be selective.
Per Barchart
Conclusion
With clear deterioration, even potentially short-lived…macro risk lingering, and capital flowing into both speculative upside and structured protection, the market appears to be teasing an inflection point. Institutional activity this week was notable—not just in size, but in intent. The positioning wasn’t reckless. It was calculated, layered, and increasingly thematic.
August may prove slower than initially expected. Breadth weakness across NYSE and NASDAQ, combined with the lack of broad leadership, supports a more cautious stance for now. But that doesn’t mean the playbook is inactive. With nearly 80% probability priced in for a Fed cut in September, the market is quietly…well, preparing or waiting.
We’ll continue monitoring both sides of the tape—long setups in high-conviction themes, and short opportunities where the fundamentals and flow don’t align. September should offer clarity. Until then, patience is a position.
Thanks for reading.
This is independent research, for educational purposes only, not financial advice.